
How important are real-time insights in delivering exceptional customer service? In today’s fast-paced business environment, contact centers play a vital role in maintaining customer satisfaction. At the heart of contact center efficiency lies the contact center dashboard, a crucial tool for monitoring and optimizing performance. These dashboards provide real-time data and visual reporting, empowering managers to make quick decisions, enhance agent performance, and improve the overall customer experience. In this blog, we will explore the definition of contact center dashboards, their key benefits, different types, emerging trends in 2024, and tips for reporting on them effectively.
Read More: Digital Workforce Management in a Call Center
What is a Contact Center Dashboard?
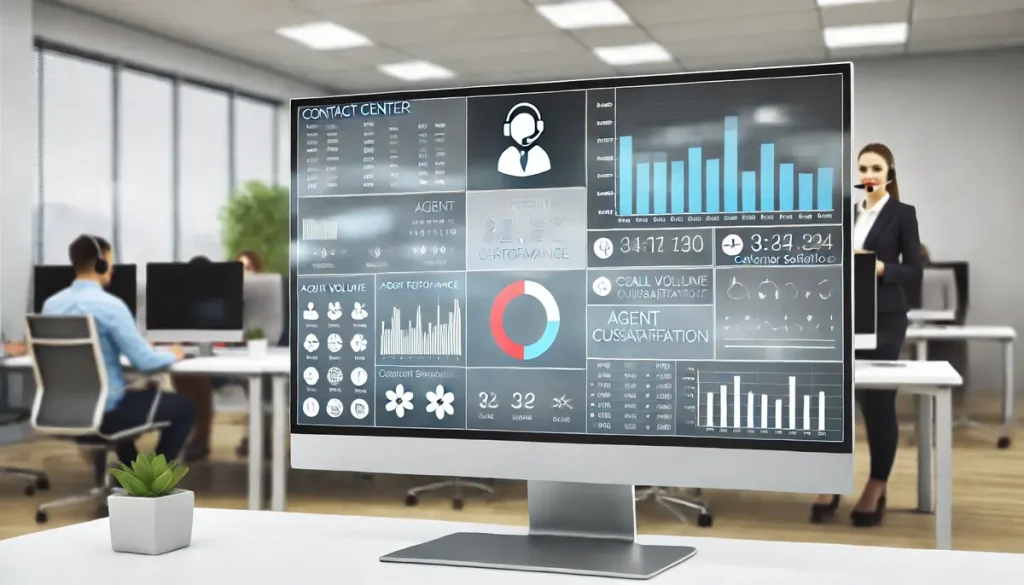
A contact center dashboard is a visual reporting tool that consolidates key metrics and data into an easily digestible format. These dashboards provide real-time, comprehensive views of contact center operations, allowing managers to monitor various performance indicators efficiently. The data displayed often includes metrics such as call volume, average handle time, and customer satisfaction scores.
By utilizing visual elements like bar charts, line charts, and heatmaps, contact center dashboards offer clear, actionable insights. These visualizations help managers track trends and detect issues as they arise, ensuring that customer service standards remain high. Whether for daily operations or long-term planning, contact center dashboards are indispensable in modern customer service environments.
Benefits of Contact Center Dashboards
Implementing contact center dashboards offers a range of benefits, making them essential tools for operational efficiency. Some key advantages include:
- Real-time Decision Making: Dashboards allow managers to make prompt, informed decisions by providing real-time data on contact center performance.
- Enhanced Visibility: With a clear overview of contact center operations and agent performance, managers can quickly spot trends and areas that need attention.
- Improved Customer Experience: Monitoring customer sentiment and feedback in real time helps enhance service quality and boost customer satisfaction.
- Optimized Agent Performance: Dashboards provide granular insights into agent performance, helping identify areas for coaching, training, and development.
- Strategic Planning: Historical data from dashboards is useful for forecasting future needs and setting long-term goals for the contact center.
- Resource Allocation Efficiency: By analyzing workload distribution, contact center managers can allocate resources more effectively, ensuring peak operational efficiency.
- Proactive Issue Resolution: Early detection of issues through real-time data enables proactive responses before they escalate into larger problems.
Contact Center Reporting vs. Analytics
In a contact center environment, it is essential to differentiate between reporting and analytics, as both play distinct roles in data management.
- Reporting: Reporting focuses on retrospective metrics, presenting structured data such as the number of calls handled, average response time, and customer satisfaction rates. Reports help contact centers understand past performance but do not typically provide forward-looking insights.
- Analytics: Analytics goes beyond basic reporting by using complex data analysis techniques to forecast future outcomes and inform decision-making. Analytics can highlight trends, predict call volume surges, and optimize resource allocation based on these predictions.
Understanding the difference between reporting and analytics is key to leveraging dashboards effectively for both operational and strategic purposes.
Different Types of Contact Center Dashboards
There are various types of contact center dashboards that serve unique purposes depending on organizational needs. These dashboards provide specific insights into various aspects of contact center operations, helping businesses optimize performance, resource allocation, and customer experience.
Operational Dashboards
Operational dashboards are designed to monitor the daily activities of the contact center, ensuring smooth operations and real-time visibility into key performance indicators (KPIs). These dashboards focus on metrics such as call volume, average hold time, abandonment rates, and service level agreements (SLAs).
- Real-time Monitoring: Operational dashboards offer immediate insights into how the contact center is performing on a minute-by-minute basis. This allows managers to respond to fluctuations in call volume or adjust agent assignments quickly.
- Core Metrics: Metrics like average hold time, call abandonment rates, and first call resolution are prominently displayed, enabling quick decisions to manage workload and maintain service quality.
- Incident Management: Operational dashboards can track issues such as system outages, call drops, or other technical problems, alerting managers to take immediate action to resolve these issues.
- Daily Optimization: The insights gained from operational dashboards help ensure that contact centers meet daily goals, minimize downtime, and maintain customer satisfaction levels throughout the day.
Agent Performance Dashboards
Agent performance dashboards focus on individual agent KPIs, providing detailed insights into how each team member is performing. These dashboards measure a variety of metrics that help identify strengths and areas for improvement.
- Key Metrics: Metrics such as average handle time, customer satisfaction (CSAT), first-call resolution (FCR), and adherence to schedule are highlighted, giving supervisors a clear view of each agent’s performance.
- Coaching and Development: By identifying underperforming agents, managers can tailor coaching sessions to address specific areas, such as reducing handle times or improving customer interactions.
- Recognition of High Performers: These dashboards also help managers recognize top-performing agents, who can be rewarded for their exceptional performance, contributing to team morale and motivation.
- Actionable Feedback: Agents can receive direct, actionable feedback on their performance based on real-time data from the dashboard, helping them adjust their approach to improve customer interactions.
Strategic Dashboards
Strategic dashboards are designed to provide insights into long-term goals and trends within the contact center. These dashboards focus on high-level metrics that influence business decisions and shape future strategies.
- Long-term Metrics: Strategic dashboards track metrics such as net promoter score (NPS), workforce utilization, and customer lifetime value (CLV), helping organizations align their contact center performance with overall business objectives.
- Forecasting: Historical data collected from strategic dashboards helps in forecasting future needs, whether it’s scaling the workforce, investing in technology, or improving customer experience.
- Aligning with Business Goals: These dashboards provide a big-picture view of contact center performance, allowing managers to align operational goals with business strategies, ensuring that customer service drives organizational growth.
- Strategic Planning: By monitoring long-term trends, strategic dashboards allow managers to plan resource allocation, training, and technological upgrades to meet future customer service demands.
Customer Experience Dashboards
Customer experience (CX) is a crucial element of a successful contact center, and customer experience dashboards are designed to track key satisfaction metrics, enabling managers to improve service quality and customer interactions.
- Customer Sentiment Metrics: Metrics like customer satisfaction score (CSAT), customer effort score (CES), and response time are prominently displayed, offering insights into the overall customer experience.
- Identifying Pain Points: Customer experience dashboards help identify pain points in the customer journey, such as long wait times, ineffective resolutions, or low satisfaction levels, allowing for immediate corrective actions.
- Enhancing Service Quality: These dashboards enable managers to monitor how customers perceive their interactions with agents, making it easier to refine processes and improve the quality of service.
- Measuring Feedback: Customer feedback is central to these dashboards, ensuring that contact centers can actively respond to complaints, improve service standards, and maintain high levels of customer loyalty.
Agent Productivity Dashboards
Maximizing the productivity of agents is a key objective for any contact center, and agent productivity dashboards focus on metrics that gauge the efficiency and output of agents throughout the day.
- Core Productivity Metrics: Metrics such as occupancy rate, task completion, and idle time are tracked to measure how effectively agents are using their time during shifts.
- Workforce Optimization: These dashboards allow managers to optimize workforce distribution, ensuring that agents are not overburdened during peak times and that resources are efficiently utilized.
- Tracking Task Completion: Dashboards can track the number of tasks completed by each agent, ensuring that workloads are evenly distributed and that performance meets set targets.
- Reducing Idle Time: By highlighting idle times, managers can reassign agents to other tasks or shift workloads to prevent time wastage and ensure maximum productivity.
Financial Dashboards
Financial dashboards focus on the cost-efficiency of the contact center by tracking financial metrics, helping businesses assess whether the contact center is meeting its financial objectives.
- Cost per Interaction: Financial dashboards calculate the cost per customer interaction, allowing businesses to assess their expenditure on customer service efforts.
- Revenue Metrics: These dashboards track revenue generated from upselling, cross-selling, or other sales opportunities during customer interactions, linking contact center performance to financial outcomes.
- Budget Management: Financial dashboards help contact centers monitor their budget allocations, ensuring that resources are being used efficiently and that spending aligns with business goals.
- Return on Investment (ROI): Tracking the ROI of customer service operations helps businesses evaluate whether they are getting the most value from their contact center investments.
Multichannel Dashboards
With customers using multiple channels for communication, multichannel dashboards are essential for monitoring performance across various communication mediums such as voice, email, and chat.
- Cross-channel Metrics: These dashboards track performance metrics across all communication channels, ensuring that service levels are consistent whether the customer contacts the company via phone, email, or live chat.
- Omnichannel View: By consolidating data from various channels into one view, managers can get a comprehensive understanding of how well each channel is performing.
- Resource Allocation: Multichannel dashboards allow managers to allocate resources more effectively by shifting agent focus based on demand across different channels.
- Channel-specific Insights: These dashboards provide detailed insights into how each channel performs, allowing managers to address inefficiencies specific to certain communication methods.
Self-Service Dashboards
Self-service dashboards track the utilization of automated tools like IVR systems and chatbots, helping reduce the need for live agent involvement and improving overall efficiency.
- Utilization Metrics: Metrics such as the number of self-service interactions, completion rates, and customer success with self-service options are tracked to gauge the effectiveness of these systems.
- Reduced Agent Workload: By monitoring self-service interactions, contact centers can reduce the workload on agents, allowing them to focus on more complex customer issues.
- Customer Satisfaction: Self-service dashboards often include customer feedback metrics, helping managers understand how satisfied customers are with self-service options and where improvements can be made.
- Cost Savings: Effective self-service tools reduce the number of calls handled by live agents, leading to significant cost savings for the contact center.
Quality and Compliance Dashboards
Quality and compliance dashboards ensure that contact centers adhere to regulatory standards and internal quality benchmarks. These dashboards track metrics related to service quality, agent compliance, and adherence to SLAs.
- Compliance Tracking: These dashboards monitor compliance with industry standards, ensuring that agents adhere to scripts, privacy regulations, and other legal requirements.
- Service-Level Agreement (SLA) Monitoring: Quality and compliance dashboards track SLAs, ensuring that the contact center meets its contractual obligations for response times and service quality.
- Audit Results: Managers can use these dashboards to track audit results, helping to maintain transparency and accountability within the organization.
- Quality Assurance: These dashboards track quality assurance scores, ensuring that agents provide high-quality service and adhere to internal performance benchmarks.
Campaign Dashboards
Marketing campaigns often involve a heavy customer service component, and campaign dashboards provide valuable insights into how well a campaign is performing from a contact center perspective.
- Conversion Rates: Campaign dashboards track conversion rates for campaigns, measuring how effectively customer service interactions lead to sales or other desired outcomes.
- Cost per Conversion: These dashboards help managers track the cost per conversion, offering insights into the efficiency and financial performance of campaigns.
- Real-time Campaign Monitoring: Managers can monitor the effectiveness of ongoing campaigns in real time, adjusting strategies based on customer responses and performance metrics.
- Performance Optimization: Campaign dashboards provide a clear view of which campaigns are driving the best results, allowing businesses to replicate successful strategies in future efforts.
Top Contact Center Dashboard Trends to Watch in 2024
As the landscape of customer service evolves, contact center dashboards are incorporating cutting-edge technologies to enhance performance management. The following trends are poised to shape how contact centers operate in 2024, providing organizations with advanced tools to monitor and optimize every facet of their operations.
Unified View
One of the most significant trends in 2024 is the shift towards a unified view of contact center performance. This involves integrating multiple data sources into a single dashboard, providing managers with a holistic perspective on all aspects of their contact center’s operations.
- Consolidation of Data: By pulling data from various systems—CRM, workforce management, call recordings, and customer feedback—contact centers can create a complete view of performance. This integration helps managers avoid data silos and ensures that decisions are based on comprehensive insights.
- Cross-Departmental Collaboration: A unified view enables better collaboration across departments, as teams can easily access and share data. Marketing, sales, and customer service can align strategies and ensure a consistent customer experience.
- Improved Decision-Making: With all critical metrics displayed in one place, managers can quickly identify trends, address issues, and make informed decisions that positively impact both customer satisfaction and operational efficiency.
- Real-Time Analytics: A unified dashboard provides real-time access to data, allowing for quicker response times when addressing performance issues or customer concerns.
Automation and Quick Action
In 2024, automation is transforming how contact center dashboards operate, with AI-powered tools playing a key role in automating routine tasks and enabling quick decision-making.
- AI Integration: AI-driven tools can analyze vast amounts of data and provide insights in real time. For example, AI can predict call volume surges or identify patterns in customer complaints, allowing managers to prepare and allocate resources effectively.
- Task Automation: Automated workflows can be triggered based on dashboard data. For example, if a spike in call volume is detected, an automated alert can notify managers to increase staffing levels or activate self-service options to reduce wait times.
- Predictive Analytics: By analyzing historical data, AI can forecast future performance and customer behavior. This allows managers to anticipate problems and take preemptive action, such as adjusting staffing schedules to meet expected demand.
- Faster Response Times: Automation reduces the time needed for managers to identify issues and respond. Dashboards can automatically flag critical metrics, enabling immediate corrective actions and minimizing the impact of any potential service disruptions.
Logical Presentation
The logical presentation of data in contact center dashboards is another key trend in 2024. As dashboards become more sophisticated, grouping related data elements together ensures that managers can easily interpret and act on the information.
- Clear Grouping of Data: Dashboards are now designed to group related data points, making it easier to spot trends and correlations. For instance, customer satisfaction metrics might be grouped with call handling times to see how agent performance impacts customer feedback.
- Efficient Decision-Making: Grouping data logically helps managers quickly access the information they need to make decisions, without having to sift through unrelated metrics.
- Simplified Layouts: Dashboards with streamlined layouts reduce cognitive load, allowing managers to focus on what’s most important. A clear, intuitive design means that key performance indicators (KPIs) are easy to locate and analyze.
- Data Relationships: By displaying related data together, managers can uncover hidden relationships between metrics that may have been overlooked in separate dashboards. This enables a more comprehensive understanding of contact center performance.
Data Drill-Down Capabilities
Data drill-down capabilities are becoming an essential feature of contact center dashboards, allowing managers to dive deeper into specific metrics for a more granular view of performance.
- In-Depth Analysis: With drill-down features, managers can click on high-level metrics (such as average handle time) to explore the underlying factors contributing to the number, such as agent performance, call types, or customer demographics.
- Problem Identification: This deeper level of analysis helps managers pinpoint the root causes of issues. For example, if customer satisfaction is low, drill-down capabilities can reveal if certain agents or call types are responsible for the decline.
- Personalized Insights: Managers can customize the data they drill into, focusing on the metrics most relevant to their department or role. For instance, a quality assurance manager might drill down into compliance metrics, while an operations manager focuses on efficiency-related data.
- Real-Time Adjustments: The ability to drill down into real-time data means that managers can make immediate adjustments. For example, they might identify an agent struggling with a specific call type and provide targeted coaching in real time.
Customization and Personalization
In 2024, contact center dashboards are becoming more customizable and personalized to meet the specific needs of different roles and departments within an organization.
- Tailored Dashboards: Managers can now tailor dashboards to their specific needs, ensuring that they only see the metrics most relevant to their role. A supervisor might focus on agent performance metrics, while an executive dashboard might prioritize financial KPIs.
- Role-Specific Metrics: Personalization allows different roles to focus on what matters most to them. For example, agents may have dashboards displaying their daily performance, while senior managers might see high-level strategic metrics.
- Flexible Interfaces: Many modern dashboards allow users to adjust the layout and data points they see, making it easier for them to monitor specific areas of interest and customize their workflow.
- Enhanced User Experience: Personalization improves the user experience by eliminating irrelevant data and ensuring that the dashboard provides only the most critical information for the user, making decision-making faster and more efficient.
Real-Time Widgets
The use of real-time widgets is a growing trend in contact center dashboards, offering instant visibility into critical metrics. These widgets allow managers to stay updated with the latest performance data at all times.
- Immediate Access to Key Metrics: Real-time widgets provide up-to-the-minute data on important metrics like call volume, customer wait times, and agent availability. This ensures that managers always have access to the latest information.
- Instant Alerts: If a key metric deviates from the norm, widgets can send automatic alerts, allowing managers to respond immediately. For instance, if customer wait times exceed a certain threshold, an alert can trigger, prompting immediate action.
- Customizable Widgets: Managers can select which metrics they want to monitor in real time, ensuring that their dashboard displays the most critical information at a glance. For example, a supervisor might monitor agent availability, while an operations manager focuses on customer feedback scores.
- Interactive Elements: Real-time widgets are often interactive, allowing managers to drill down further into specific metrics or adjust display settings for more detailed views of performance.
Cloud Compatibility
As more contact centers adopt cloud technologies, cloud compatibility is becoming an essential feature for dashboards. Cloud-based dashboards offer flexibility, scalability, and seamless integration with other cloud-based systems.
- Access from Anywhere: Cloud-based dashboards allow managers to access performance data from any location, ensuring that they can monitor the contact center’s operations even when working remotely.
- Seamless Integration: These dashboards integrate easily with other cloud-based systems, such as CRM platforms, workforce management tools, and customer feedback solutions, offering a unified view of contact center performance.
- Scalability: Cloud-based dashboards are highly scalable, allowing businesses to easily add new users, data sources, or features as their contact center grows. This ensures that dashboards can adapt to the changing needs of the business.
- Reduced IT Dependency: With cloud-based dashboards, organizations can reduce their reliance on IT teams for maintenance and upgrades. Cloud providers handle software updates, security patches, and infrastructure management, ensuring that the system is always up to date.
Tips for Reporting on Contact Center Dashboards
Effective reporting is essential for making the most of contact center dashboards. Here are some tips to help you create impactful reports:
- Define Clear Objectives: Ensure that reports align with specific business goals, whether it’s improving customer satisfaction or optimizing agent productivity.
- Tailor Reports to the Audience: High-level executives need big-picture insights, while managers require detailed metrics to drive day-to-day performance.
- Use Visualizations Wisely: Choose the right visualizations—bar charts, line graphs, pie charts—that best represent the data you’re reporting on, ensuring clarity and relevance.
- Provide Historical Context: Compare current metrics with historical data to identify trends and provide context for performance improvements or declines.
- Highlight Key Performance Indicators (KPIs): Focus on the most critical metrics that impact overall contact center performance, such as first-call resolution, average handle time, and customer satisfaction.
- Interactive Reporting: Enable drill-down features in reports to allow users to explore data more deeply, leading to better insights and action plans.
- Regular Updates: Keep reports relevant and up to date by reviewing and refreshing the data regularly to reflect current performance.
Conclusion
In the business landscape, contact center dashboards have become an essential tool for improving operational efficiency and customer satisfaction. By providing real-time insights, they allow managers to monitor performance, optimize resources, and proactively resolve issues. As we move into 2024, staying on top of the latest trends and best practices for dashboard reporting is crucial for maintaining a successful contact center operation. Consider integrating dashboards into your contact center to enhance visibility, drive informed decision-making, and boost overall performance.